18 Paired Numerical Samples
We work with the famous dataset that Pearson collected on the heights of men and their sons.
18.1 Scatterplot
This is an appropriate plot for paired numerical data.
require(UsingR)
plot(father.son, pch = 16, xlab = "father's height", ylab = "son's height", asp = 1)
abline(1, 0, lty = 2) # diagonal line (congruent with what follows)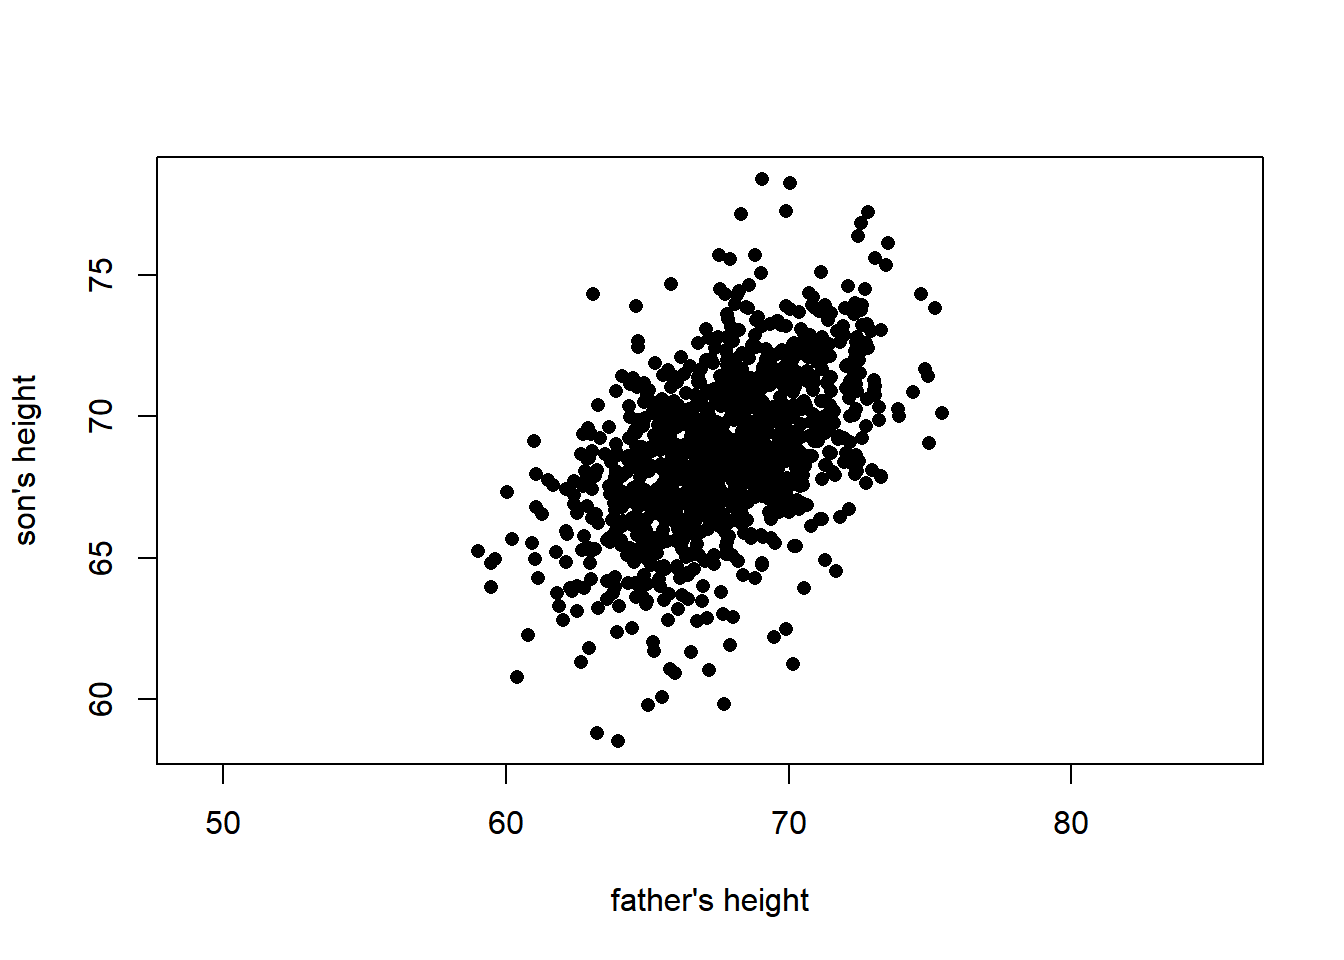
18.2 Testing for symmetry
The observations are paired (father, son). We take difference and test for symmetry using the Wilcoxon signed-rank test. (According to the manual, the exact p-value, i.e., the permutation p-value, is returned when there are 50 observations or fewer.)
Wilcoxon signed rank test with continuity correction
data: father.son$sheight and father.son$fheight
V = 405955, p-value < 2.2e-16
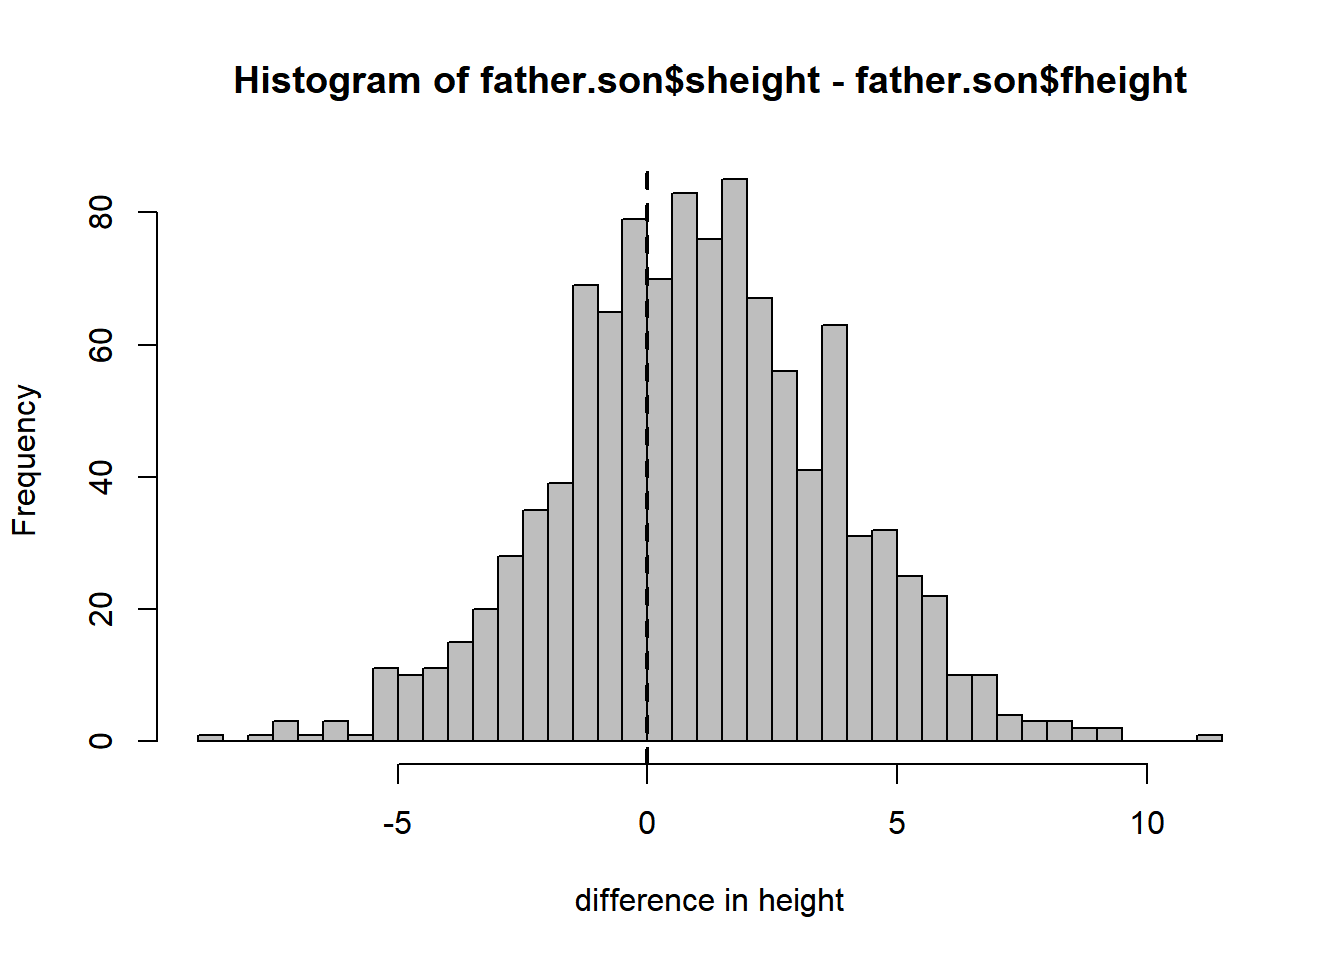
alternative hypothesis: true location shift is not equal to 0There is strong evidence that the distribution of the difference in heights is not symmetric (about 0). This is apparent when plotting a histogram.
hist(father.son$sheight - father.son$fheight, breaks = 50, col = "grey", xlab = "difference in height")
abline(v = 0, lty = 2, lwd = 2)